Hanover Bancorp, Inc. /MD (HNVR)·Q4 2025 Earnings Summary
Hanover Bancorp Earnings Crushed by Credit Cleanup, But Core Metrics Shine
January 29, 2026 · by Fintool AI Agent
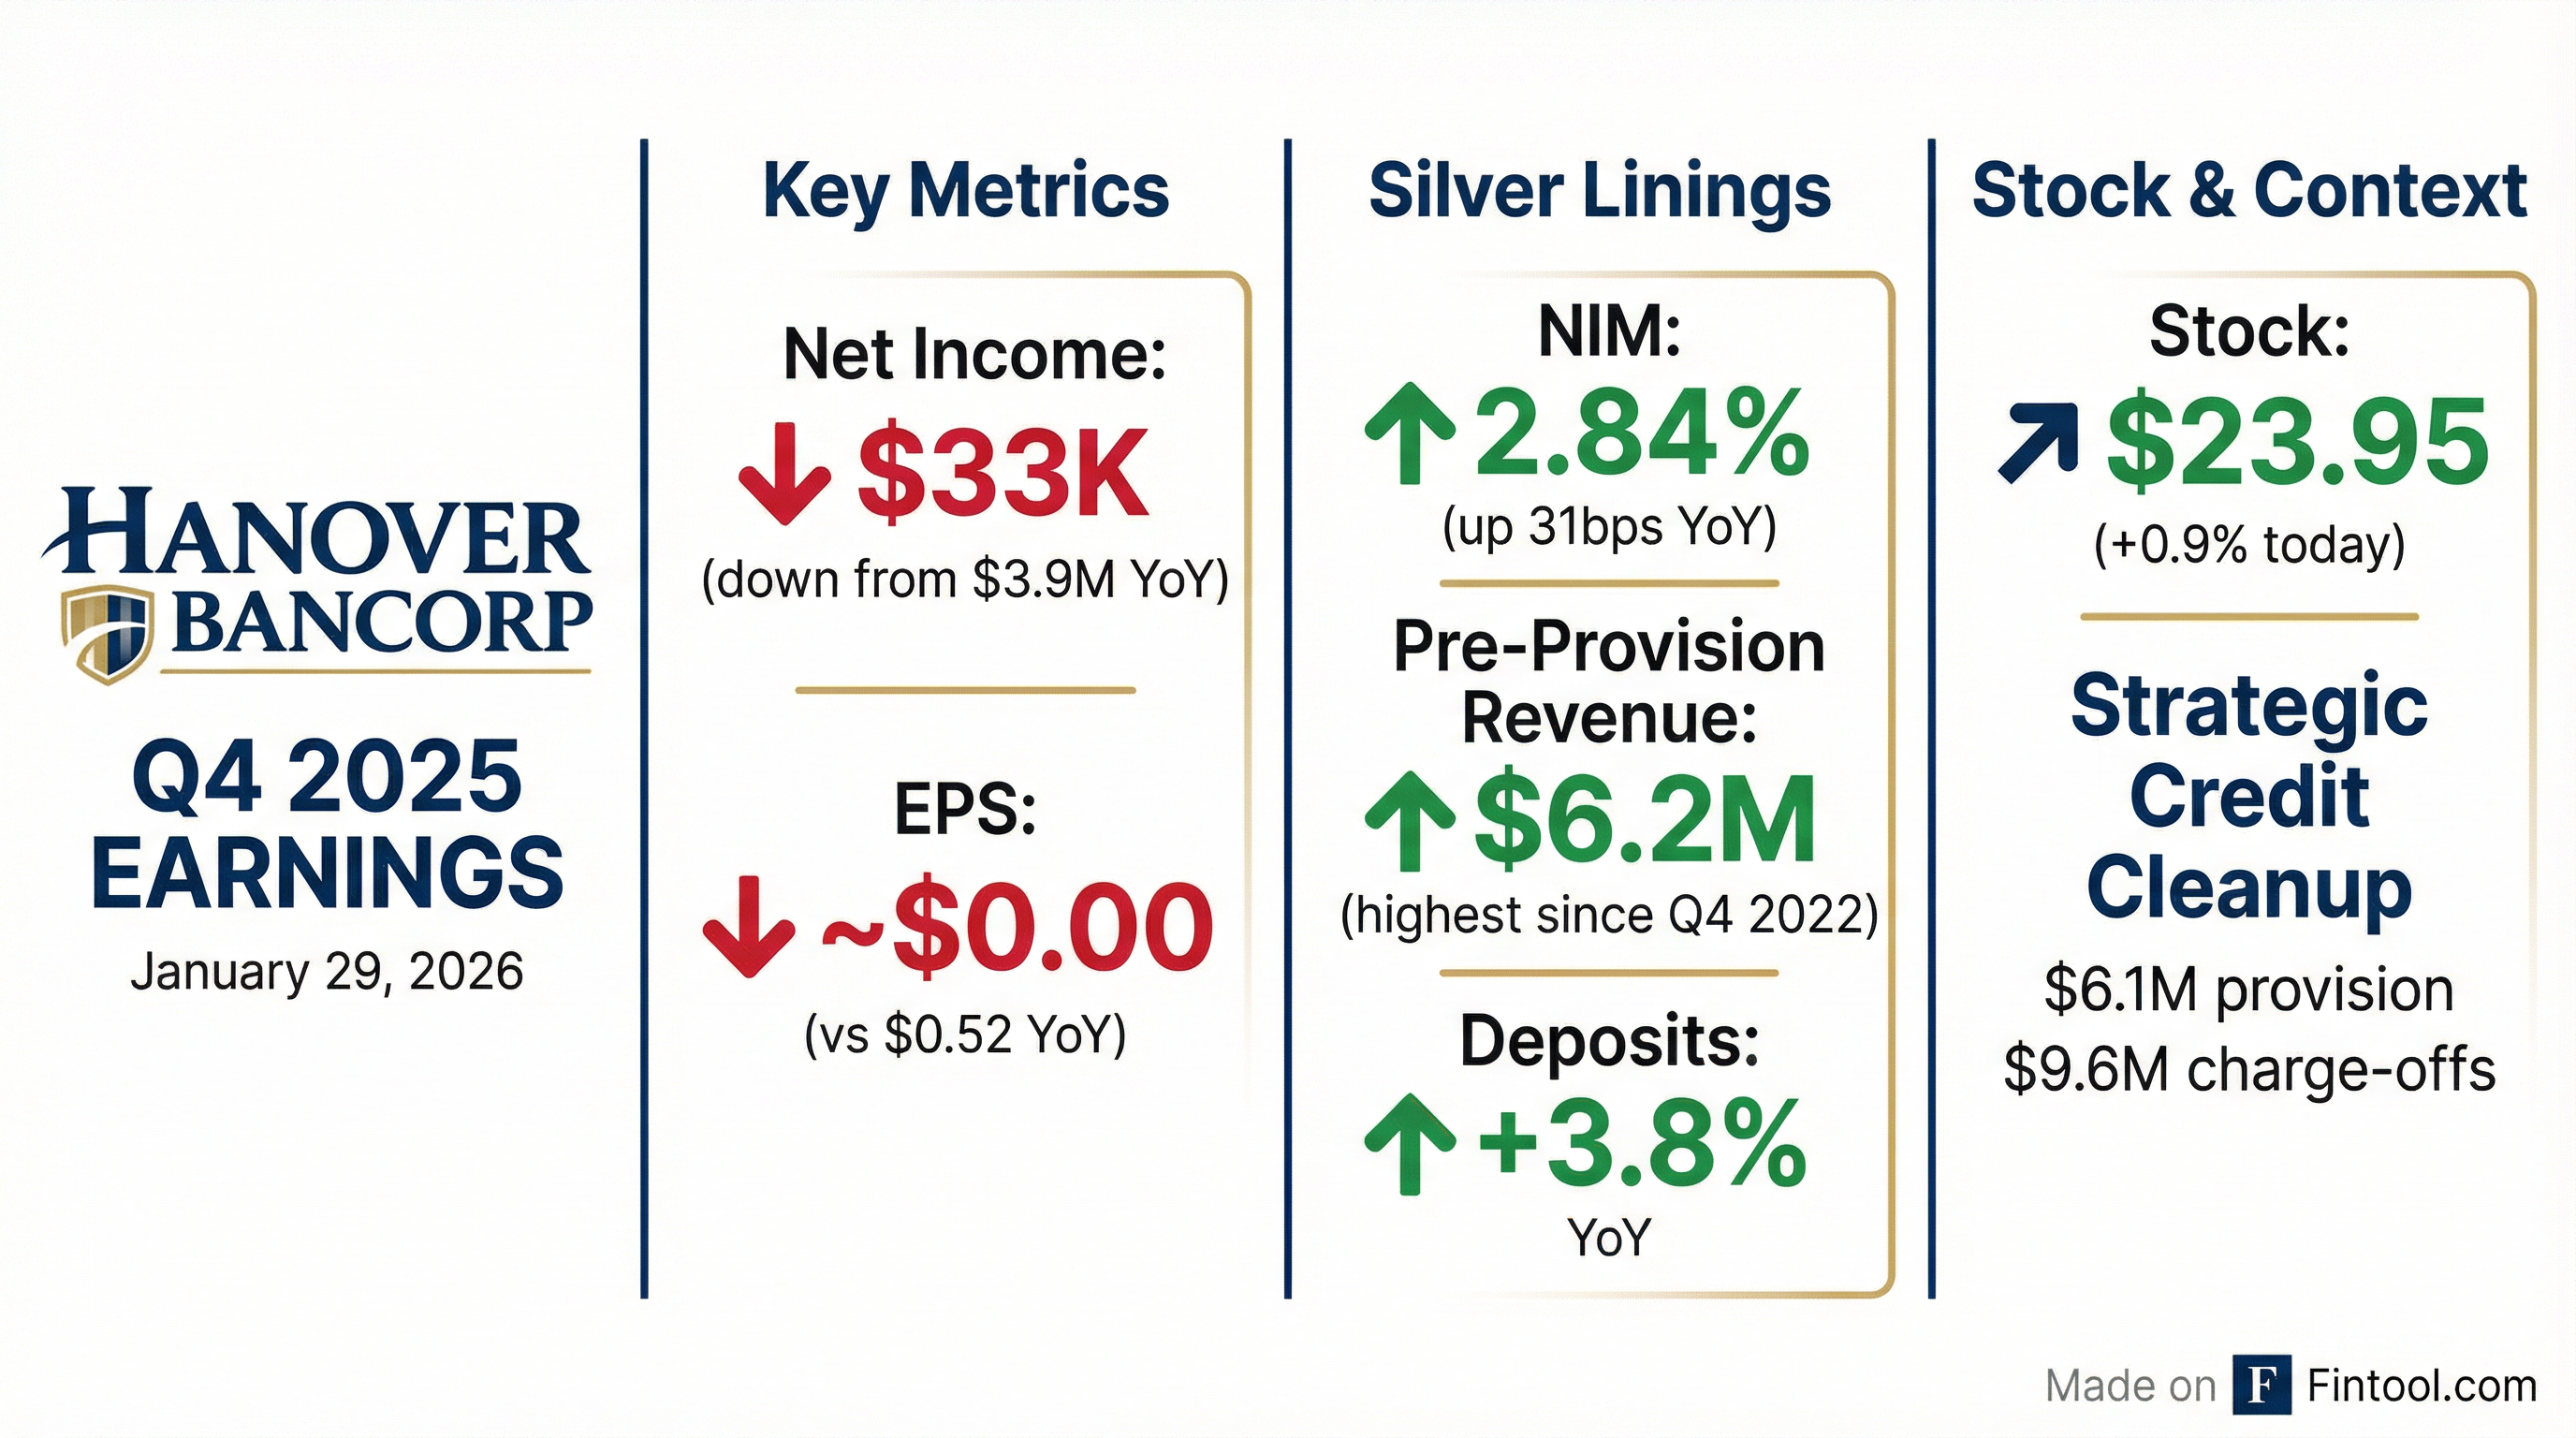
Hanover Bancorp (HNVR) reported Q4 2025 net income of just $33 thousand—essentially breakeven—after taking a $6.1 million provision for credit losses and recording $9.6 million in charge-offs as part of a "strategic credit cleanup." This compares to net income of $3.9 million in Q4 2024.
But beneath the headline miss, the Long Island-based community bank delivered its strongest core operating performance in years: net interest margin hit 2.84%, the highest since Q4 2022, and pre-provision net revenue reached $6.2 million, also a multi-year high.
The stock closed at $23.95, up 0.9% on the day of the announcement.
Did Hanover Beat Earnings?
No—but context matters.
The entire earnings shortfall traces to a deliberate decision to clean up the credit portfolio. Management initiated what they called a "strategic credit cleanup" that removed $9.6 million of non-performing loans from the balance sheet through a combination of charge-offs and loan sales.
The $9.6 million in charge-offs included:
- $4.0 million partial charge-off on a C&I loan impacted by tariffs and economic challenges
- $5.6 million in full and partial charge-offs on NPLs with previously established reserves
- $709 thousand from the sale of $5.0 million in 1-4 family residential NPLs
What's Actually Going Well?
Strip out the credit cleanup, and Q4 2025 was Hanover's best operating quarter in years:
Net Interest Margin: Multi-Year High
The cost of interest-bearing liabilities dropped to 3.67% from 4.24% a year ago—a 57 basis point improvement—while asset yields declined only 22 basis points. The bank is benefiting from being liability-sensitive in a falling rate environment.
Pre-Provision Net Revenue: Highest Since Q4 2022
Efficiency Ratio: Best Since Q1 2024
Operating efficiency improved to 66.46% from 68.91% a year ago.
What Did Management Say?
CEO Michael Puorro framed the quarter as a deliberate positioning move:
"Our fourth quarter core performance, as evidenced by our steadily increasing NIM, expanding commercial deposit base, diversifying verticals and strong Pre-Provision Net Revenue of $6.2 million, underscored the strength of our growing opportunity. With the decision in the fourth quarter to address the impact of certain challenging credits through proactive and focused NPL resolution, we have positioned the Bank for what we believe will be sustained performance in 2026."
On growth strategy:
"Strong loan pipelines, opportunistic relationship-based CRE lending in and around Long Island, while continuing to pro-actively manage our concentration ratio and expanding our commercial branch footprint all point to Hanover Bank as the bank of choice for business owners across Long Island and the broader New York Metro area."
Balance Sheet Highlights
Book value per share increased to $27.02 from $26.48 a year ago. Tangible book value rose to $24.41 from $23.86.
The loan-to-deposit ratio improved to 99% from 102% a year ago, reflecting stronger deposit gathering.
Credit Quality: The Full Picture
The strategic cleanup increased NPLs in the short term:
The allowance declined to 0.93% of loans as $9.6 million was charged off against previously established reserves.
CRE Concentration: Improving
The commercial real estate concentration ratio improved to 360% of capital from 385% a year ago. Office exposure remains minimal at just 2.48% of total loans ($49.6M), with less than 1% in Manhattan.
Stock Performance
HNVR shares closed at $23.95, up 0.9% on the day of the announcement. The stock trades at:
- 0.89x tangible book value ($24.41 TBV)
- 0.89x book value ($27.02 BV)
Over the past year, HNVR has traded between $18.31 (52-week low) and $27.00 (52-week high).
Capital Return
Dividend: The Board declared a $0.10 per share quarterly cash dividend on both common and Series A preferred shares, payable February 26, 2026 to stockholders of record February 12, 2026.
Buybacks: During Q4 2025, the company repurchased 56,711 shares at a weighted average price of $22.60, representing approximately 0.8% of shares outstanding. As of December 31, 2025, 284,075 shares remain authorized for repurchase.
What to Watch in 2026
-
NIM sustainability: Management highlighted a "liability sensitive balance sheet" as beneficial if rates continue declining.
-
Loan growth: The pipeline stands at $151.6 million, with 68% in niche-residential, SBA, and USDA lending.
-
New branch: Hanover expects to open a full-service branch in Riverhead, NY later in 2026, with a temporary office operational by end of Q1 2026.
-
Rate resets: 25% of multifamily and CRE-investor loans will reset or mature in 2026, with another 56% in 2027. This creates both risk and opportunity as borrowers refinance at higher rates.
-
C&I growth: C&I loan originations were $95.3 million for full-year 2025, with management expecting continued growth in 2026.
Full Year 2025 Summary
Excluding $2.6 million in core system conversion expenses (net of tax), adjusted net income was $10.1 million or $1.35 per diluted share.
Bottom Line
Q4 2025 was a tale of two banks: the headline numbers were ugly, but management made a deliberate choice to clean up the credit portfolio ahead of 2026. Core banking metrics—NIM, pre-provision revenue, efficiency—all hit multi-year highs. The question for investors is whether this positions Hanover for sustained improvement or whether more credit issues lurk in the portfolio.
At 0.89x tangible book, the market appears to be taking a wait-and-see approach.
Related: HNVR Company Profile | Q4 2025 Transcript | Q3 2025 Earnings